In the last two issues of FRONT of HOUSE, we covered some of the principles underlying loudspeaker horns, and discussed the development of the constant directivity horn. Horn loudspeakers in professional audio have a challenging task, namely providing consistent directional control over a range of multiple octaves. Throw in the desire to use the smallest practical horn and produce maximum output, and the challenges facing the horn designer are appreciable.
This month, we’ll discuss the current state of horns in professional audio. We’ll touch on techniques that are improving horn design, areas of ongoing study in horn behavior, and delve into the wave shaping devices in line arrays.
Constant Directivity Lives
Ever since D. B. Keele’s introduction of the constant directivity (CD) horn in the 1970s, manufacturers from all corners of the globe have continued to chase after improvements in the evenness of loudspeaker coverage. Professional loudspeakers always need to place sound on the audience, but not on the architecture, so the goal of controlled, consistent directivity will be with us perpetually.
Shortly after the arrival of the CD horn came an era where loudspeaker directional coverage in challenging environments was dominated by large compression drivers on very large constant directivity horns. That “flying junkyard” era has largely passed for the industry, with today’s focus on modularizing the loudspeaker components — and their directivity control — into the most flexible and scalable packages feasible.
As a result of the push to more modular solutions, modern loudspeaker arrays tend to rely on more than merely loudspeaker horns for directivity control. Today’s systems commonly operate in a hybrid configuration where directional control at higher frequencies comes from a horn waveguide, while directional control of mid and lower frequencies derives from the controlled spacing and signal fed the other transducers. Essentially, all vertical arrays on the market operate in this manner. Even fully “horn-loaded” line array products behave in a manner not unlike the old multi-cellular horns in the midrange and lower frequencies. At these frequencies, the directivity is shaped by the collective output of a number of horn “cells” formed by each box in the line array.
A Hybrid Approach
Unlike the old multi-cell horn, however, the increase in computing power which leads to digital signal processing (DSP) now allows the industry to precisely tailor the amplitude and time relationships of the signal that’s fed to each loudspeaker box, or even to each individual driver. This level of digital processing allows us to shape the sound leaving the array in a way that was unavailable at the dawn of the constant directivity horn.
For example, a multi-cellular horn exhibits a narrowing of its directional coverage near the low end of its operating range. An array of boxes (e.g., a line array hang) also exhibits the same effect. For the multi-cellular horn, there was little opportunity to mitigate this effect, as a single horn driver fed each cell of the horn with the same signal. By contrast, using DSP we can now feed each box in the array a carefully tailored signal to all but eliminate this narrowing effect.
Computer Modeling
Beyond DSP processing of arrays, computers have also shaped the way in which horns are modeled and designed. A brief overview of the history of horn analysis helps frame these improvements. Early in the 20th century, it became interesting to try applying mathematical descriptions to how sound moves through an expanding horn flare. The first systematic math for this is known as Webster’s horn equation, developed in 1919 by Arthur Webster.
Webster’s equation makes a key assumption — that the shape of a pressure wave in a horn flare can be described by a single parameter wave shape. There are three single parameter descriptions of a wave’s shape: the traveling plane, the expanding cylinder and the expanding sphere. Waves moving in real-world horns generally don’t travel in any of these shapes, though much of the existing mathematical work treats the waves moving as a plane wave to simplify the calculations. Thus, while Webster helped people tackle the math of horns in the pre-computer era, there is a glaringly insufficient assumption built into the equation. At the time Keele developed the constant directivity horn, horn designers were still doing calculations on models built around plane waves.
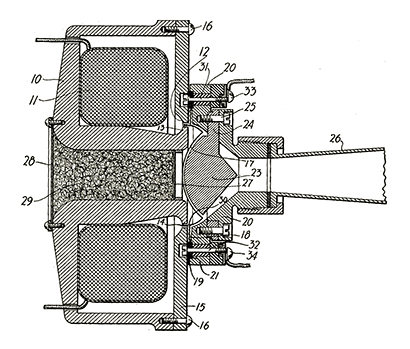
Computers now allow speaker developers to work with the fundamental wave propagation math that is behind sound waves moving in a horn. This math is formulated in special way using an equation called the “Helmholtz integral.” The Helmholtz integral is then numerically solved by computers using the Boundary Element Method (BEM). Fig. 1 (top of this page) shows the schematic of a horn analyzed via BEM. The triangles on the surface of the horn represent the “mesh” of points where the equations are analyzed. Working with BEM requires no specific assumptions about the shape of the wave as it travels through the horn. BEM lets manufacturers develop horn flares with consistent directivity characteristics that have a more subtle transition from throat to mouth. BEM calculations can also be performed for waves in other environments like compression driver phase plugs, loudspeaker enclosures, arrays of loudspeakers, etc.
Better Measurement
In addition to better horn modeling capabilities, we now have more advanced measurement techniques. One of those techniques is known as “wavelet” analysis, which is an alternative to conventional Fast Fourier Transform (FFT) analysis. In FFT analysis, we look at either the “impulse” behavior, which plotted as pressure vs. time, or the magnitude and phase response. A magnitude graph is what manufacturers typically place on their loudspeaker product datasheet, and is also commonly known as a frequency response graph. The math of FFT allows us to swap back and forth between the two views of the data.
Wavelet analysis is something of a hybrid between the impulse and magnitude ways of displaying data. Wavelet analysis lets users see elements of the impulse and magnitude response at the same time, and can help make sonic anomalies more obvious. The following graphs illustrate the point:

 vs. measured (red) response of a midrange horn") Fig. 2 shows the magnitude response of an idealized midrange horn (blue) and the real, as-measured horn (red) on the same graph. Fig. 3 shows the wavelet spectrogram of the idealized horn in Fig. 2. Fig. 3’s vertical axis is frequency (Hz), and horizontal axis is time (milliseconds). The color of the signal indicates its volume. In Fig. 3 all frequencies are seen to smoothly decay to a lower volume as the color transitions from red to black. The low frequencies take longer to decay merely because they have a longer period of oscillation.
Fig. 2 shows the magnitude response of an idealized midrange horn (blue) and the real, as-measured horn (red) on the same graph. Fig. 3 shows the wavelet spectrogram of the idealized horn in Fig. 2. Fig. 3’s vertical axis is frequency (Hz), and horizontal axis is time (milliseconds). The color of the signal indicates its volume. In Fig. 3 all frequencies are seen to smoothly decay to a lower volume as the color transitions from red to black. The low frequencies take longer to decay merely because they have a longer period of oscillation.
 By contrast, Fig. 4 shows the wavelet spectrogram of the measured horn from Fig. 2. The wavelet analysis makes it clearer to visualize how the frequency response anomalies from Fig. 2 also cause changes in the decay versus time of the horn. Wavelet analysis helps us easier see how the time and frequency are tied at the hip, and is useful for reducing the coloration of horn designs.
Smarter Designs
Better modeling and measurement of loudspeaker horns allows for smarter compromises in sound system development. As we discussed in part one of this series, horns are inherently reflective devices. One of the questions that Keele tackled after developing the constant directivity horn is whether there was an optimum size for the horn mouth to reduce reflections from the mouth. The question of reducing horn reflections remains a relevant one today, as the industry tries to improve the sound emerging from horns that are placed in increasingly compact loudspeakers.
Smaller horn mouths can lead to more problematic reflections down the horn. The same consideration holds true at the transition between line array wave-shaping devices and the horns that they exit into. Careful control of the transition from a wave “flattening” device into the horn flare will result in improved performance.
Similarly, many wave-shaping devices for vertical arrays make assumptions about the shape of the incoming sound from the compression driver. Application of advanced modeling to the compression driver ensures that the wave that leaves the compression behaves as desired, especially at very high frequencies where the geometry inside the compression driver can adversely shape the output wave.

 Improving horn behavior anomalies is a problem that can also be tackled using DSP in circumstances where the horn behaves “consistently inconsistent” over the desired coverage pattern. To illustrate these improvements, we again turn to wavelets. Fig. 5 is the spectrogram of a horn from Fulcrum Acoustic that does not have DSP correction applied. Fig. 6 is the same horn after application of their TQTM processing algorithm. The wavelet analysis shows how the DSP processing improves the uniformity and smoothness of the horn’s decay.
With the increasing availability of flexible finite impulse response (FIR) filters, sophisticated pre-processing of the signal now allows a digital approach for attacking physical problems within loudspeaker horns. In the specific circumstances where digital manipulation is appropriate, the loudspeaker designer now has another arrow in the quiver as they chase ever more compact and flexible horn designs.
Conclusion
Improvements not withstanding, certain idiosyncrasies of horns will likely never be eliminated. Horns will remain devices that experience reflections, and devices whose performance depends on the wavelength of sound that travels through them. We will probably always desire them to be smaller and provide more output.
At the end of three articles on the behavior of horns, it is apparent that much has improved in our ability to model, measure, and improve the sonic character of the horn devices we rely on to direct sound coverage evenly over the audience. Computing power allows us to grasp hold of something as indistinct as a sound wave rapidly leaving the compression driver for a short flight through the horn out into the open air, to visualize something our senses otherwise miss completely. Personally, I look forward to seeing (and hearing) what other clever bits of performance designers will continue to squeeze out of the complexities inherent in horns. It could be interesting.
Note: The author would like to thank Dave Gunness of Fulcrum Acoustic (fulcrum-acoustic.com) for the wavelet analysis figures.